Written by Brayden Zimmerman ’20
Bucknell’s most recent survey found that Americans are becoming more pro-immigrant. But there are still large segments of the country who still hold at least some anti-immigrant views? What differentiates those who hold pro- and anti-immigrant views? Our survey shows that it is a fear that immigrants might be violent.
A nationally representative survey, conducted by YouGov for the Bucknell Institute for Public Policy during the week of March 26-31, asked respondents how well they thought each of these describes new immigrants to the United States: hardworking, ambitious, violent, and intelligent. We found that, overwhelmingly, respondents of all political affiliations thought new immigrants were hardworking, ambitious, and intelligent. We found that Republicans tended to believe new immigrants are violent, while Democrats believed that they are not.
The majority of respondents believed that new immigrants are hardworking, ambitious, not violent, and intelligent. Over 80% of respondents believed that immigrants are hardworking and ambitious, while only 34% of respondents believed that new immigrants are violent. A little less than three-quarters of respondents believed that immigrants are intelligent.
We began by looking to see if there was a relationship between level of education and views about immigrants. We found that the majority of those from differing education levels all responded that new immigrants are hardworking, ambitious, and intelligent. We found that a large majority of those with college degrees or post graduate education believed that immigrants are not violent, while those with a high school degree or less were split. Half of those with a high school degree or lower believed that new immigrants are violent and half disagreed.
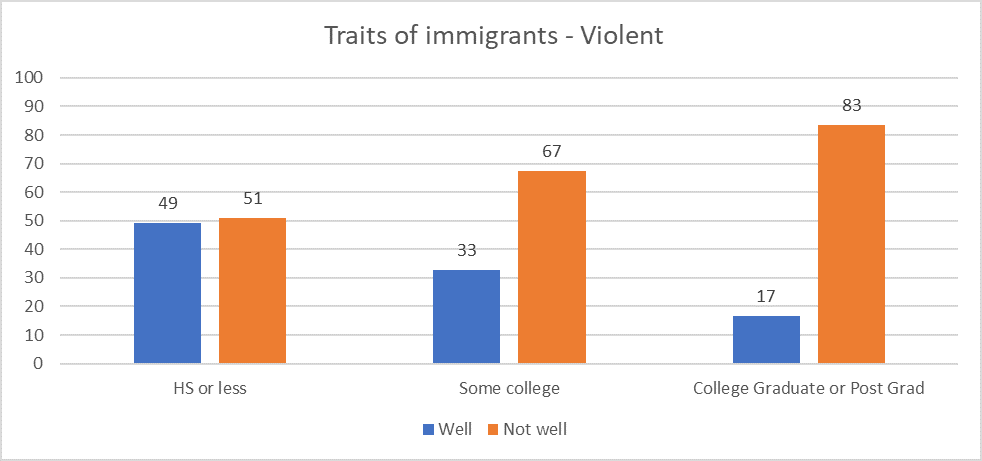
Figure 1: Traits of Immigrants: Violent by Education
Things get interesting when we compare by party.
We find that the majority of democrats and republicans believed that new immigrants are hardworking (95% of democrats and 78% of republicans), ambitious (93% of democrats and 68% of republicans), and intelligent (84% of democrats and 58% of republicans). The difference comes for the question of whether new immigrants are violent. The majority of republicans believed that new immigrants are violent. Only a little under one-quarter of democrats agreed.
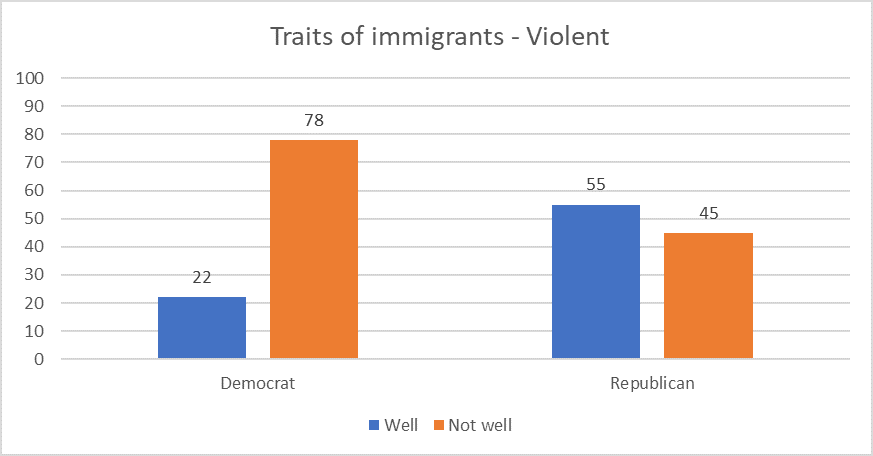
Figure 2: Traits of Immigrants: Violent by Party
The following figure displays how polarized views are about this question when it comes to ideology.

Figure 3: Traits of Immigrants: Violent by Ideology
The clear difference here is that republicans and conservatives believed that new immigrants are violent, while democrats and liberals did not. This could be due to the rhetoric of the current president and the large focus that the republican party gave to violent illegal immigrants during their convention. This data seems to point to the conclusion that the major factor that drives the majority of republicans to be skeptical of new immigrants is the concern of violence.
For information on methodology, see below.
YouGov interviewed 1116 respondents who were then matched down to a sample of 1000 to produce the final dataset. The respondents were matched to a sampling frame on gender, age, race, and education. The frame was constructed by stratified sampling from the full 2016 American Community Survey (ACS) 1- year sample with selection within strata by weighted sampling with replacements (using the person weights on the public use file).
The matched cases were weighted to the sampling frame using propensity scores. The matched cases and the frame were combined and a logistic regression was estimated for inclusion in the frame. The propensity score function included age, gender, race/ethnicity, years of education, and region. The propensity scores were grouped into deciles of the estimated propensity score in the frame and poststratified according to these deciles.
The weights were then post-stratified on 2016 Presidential vote choice, and a four-way stratification of gender, age (4-categories), race (4-categories), and education (4-categories), to produce the final weight.